Analyzing your payments data to the right breadth and depth is a challenge. You might not succeed every day, but you can certainly gain a far better understanding with a smart strategy. Yet, truth be told, it can be hard to know where to begin
In an era of big data, you need a single source of truth sooner or later. Data processing tools such as a payment analytics dashboard will get you a long way in the right direction. You may have a hunch about what’s going on, but the numbers don’t lie. And you need evidence to back up your strategic recommendations. Suffice it to say, the clarity of your graphs can critically impact buy-in from around the business – not to mention your own insight into the state of play.
But the best analytics toolkit is useless without a clear idea of business-critical metrics. You need to know what you’re trying to achieve, after all. Whether you’re doing your analysis by hand, using spreadsheets, or a third-party tool, it helps to know what to look out for.
To that end, this article will outline the most important payment analytics metrics to focus on.
What you can learn about your customers from payment metrics
You might not believe payments analytics hold much value beyond the payments department. However, this work can surface vital insights that benefit the entire business and guide broader strategic decision-making.
Use cases for payment analytics include deepening understanding of how your customers like to buy – and how they don’t. Digging into your current and historic transaction data can reveal logical next-steps on revenue growth, customer retention strategy, resource allocation, and ROI calculation. If you can find evidence for what’s working and what isn’t, then you’re better equipped for future endeavors.
Here are just a few of the customer insights you can gain from payments analytics:
- Most popular payment methods per region, per transaction type. If you isolate the volume of transaction processing per payment channel, you can see which are most successful and which are less favored by your buyers. This helps to calculate ROI of each payment channel.
- Transaction amounts helps to inform your special offer and discount strategies. For instance, you could boost revenue if you offer a percentage discount on orders of at least $X.
- Payment velocity patterns can guide when to allocate staff to process returns or subscription cancellations. An example could be you notice a spike in refund requests in January each year, and should therefore increase customer service availability during that time.
Here’s a snapshot of the Checkout.com analytics dashboard, to illustrate how transaction data visualization provides instant insights into priorities and concerns.

What to prioritize: Business-critical payment analytics
In a sea of data, it makes sense to prioritize the strongest currents. You should consider the strongest forces acting on your core business metrics: P&L, revenue, customer churn, and compliance.
No matter your industry, if your business takes payments, you should be looking at the following:
1. Decline rates and reasons
Did you know 45% of customers will not retry a payment if it declines on first attempt? Imagine the impact on your business if you lost such a large chunk of custom due to imperfect payment technology. Our research found a further 42% feel put off from returning to an app or website following a false decline. Are you seeing the revenue leak here?
You should zone in on the reasons behind your payment declines. This will tell you what your problem is and what actions to take next. For example, if your customers have expired cards or there are 3DS failures then that guides your next steps.

Examining the bank response codes in the context of the transaction payment method, region, currency, and card scheme (if applicable) can provide clues about what’s going wrong. Doing so equips you to spot trends, and develop strategies to address your findings.
Despite the importance of this data, our research found 65% of merchants do not receive detailed raw response codes on failed payments. This only highlights the problem of a paucity of data in the payments sector.
Looking at payment error codes in aggregate gives you useful guidance about possible faults in your setup. There could be a miscellany of reasons why each individual transaction failed. That’s why it’s important to work with a payment processing provider that will provide access to this data, and ensure you have the tools to interpret it.

We secured an acceptance rate increase of 9+% for one business after we analyzed its decline response data and made technical adjustments. This translates to exponential gain in revenue – which, of course, is what any business wants. You can achieve gains of your own by investigating ways to mitigate false declines, i.e. payments that should have gone through first time.
Of course you cannot – and should not – try to rescue fraudulent payment attempts. We’ll consider fraud monitoring analytics in the final section.
2. Transactions per geographic location
If you trade across more than one nation, you should consider your payment data by country level. This enables you to identify where you are strong and where you are weak to narrow your focus.
If your research reveals recurring payment failures in a specific region it’s surely worth a closer look. Such work is particularly time-critical in the early stages of expansion into a new region; without a loyal customer base in a given locale, a few negative checkout experiences could easily burn customer trust and exacerbate churn.
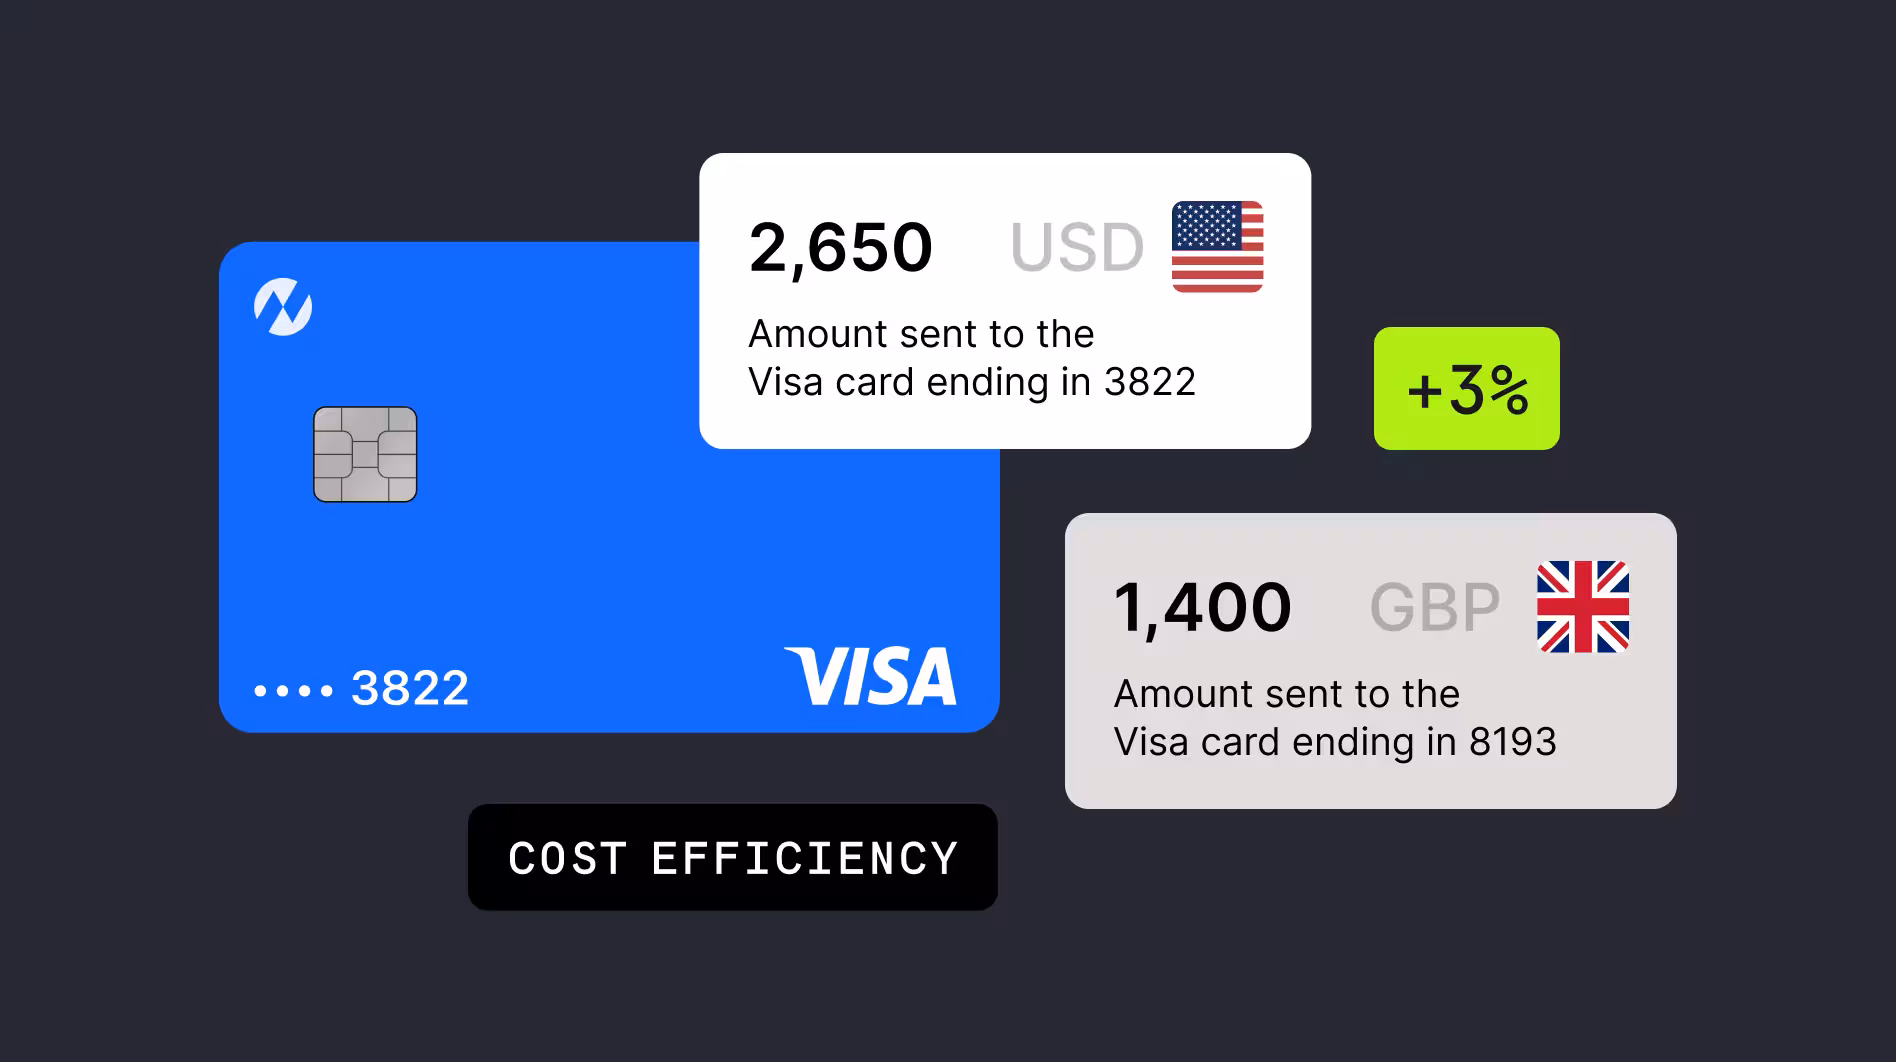
It’s worth also considering your costs for processing payments across borders. It can be challenging to calculate the exact costs of your foreign exchange (FX) payments, because separate fees from different parties may be rolled together into one total.
However, your fee structure is likely to vary depending on your local acquiring and processing partners. So if you have more than one of these PSPs serving your business in a particular region, you could analyze the relative transaction costs of each.
Note, this is hard to narrow down to a perfect science because exchange rates fluctuate daily, and buyers may use different payment methods (which come with their own varying costs).
Nevertheless, certain PSPs will offer more favorable or more expensive rates for local payment processing, so it pays to compare and contrast where you can. Work with your account manager to uncover as much cost transparency into regional processing as you can.
If you are using an orchestration layer or any kind of intelligent payment routing technology, you can check that your payments are routed via the least expensive (yet most suitable) journey. If not, then ask your account manager or in-house payment team to find out whether you can make savings.
3. Transaction types: subscription vs one-off payment
It’s a good idea to analyze your transactions in the context of frequency and type. After all, your strategy is not likely to be the same for one-off customers and long-term subscribers.
Here’s a summary of the different payment metrics you should focus on per payment type:
Based on your recurring payments data, you can calculate the average duration of a subscription. This is extremely useful information to guide your sales and marketing strategy. Once you know the average expected revenue (or profit) per subscriber, you can adjust your maximum total cost per acquisition (i.e. the upper limit of marketing spend to obtain a new buyer).
Filtering your payments data down to recurring payments can help you calculate the retention and churn rates for your subscription-based products. You can also measure the profitability of marketing campaigns to win back churned subscribers based on the reactivation rate within certain time periods.
4. Compliance
You need to ensure you’re sending the right amount of data along with each payment request – which is often easier said than done. It’s critical to align your payment messaging with the expectations of each card scheme you’re transacting with, as well as the financial processing laws of the nation in which you’re trading.
If you serve customers in multiple locations, this quickly becomes burdensome if you’re operating without specialized knowledge of local acquiring. You may hit a wall with intolerably high decline rates in certain geographies because your payment messaging is not up to the standard of local payment processing requirements.
On top of acceptance rates, you should also analyze the proportion of transactions which are processed with Strong Customer Authentication (SCA). If you’re accepting payments in a region which doesn’t require SCA, it’s worth monitoring the success of payments via certain card schemes and issuers using various levels of additional authentication measures. Pay attention to any fluctuations in terms of acceptance rate, cart abandonment or fraud to guide your next steps.
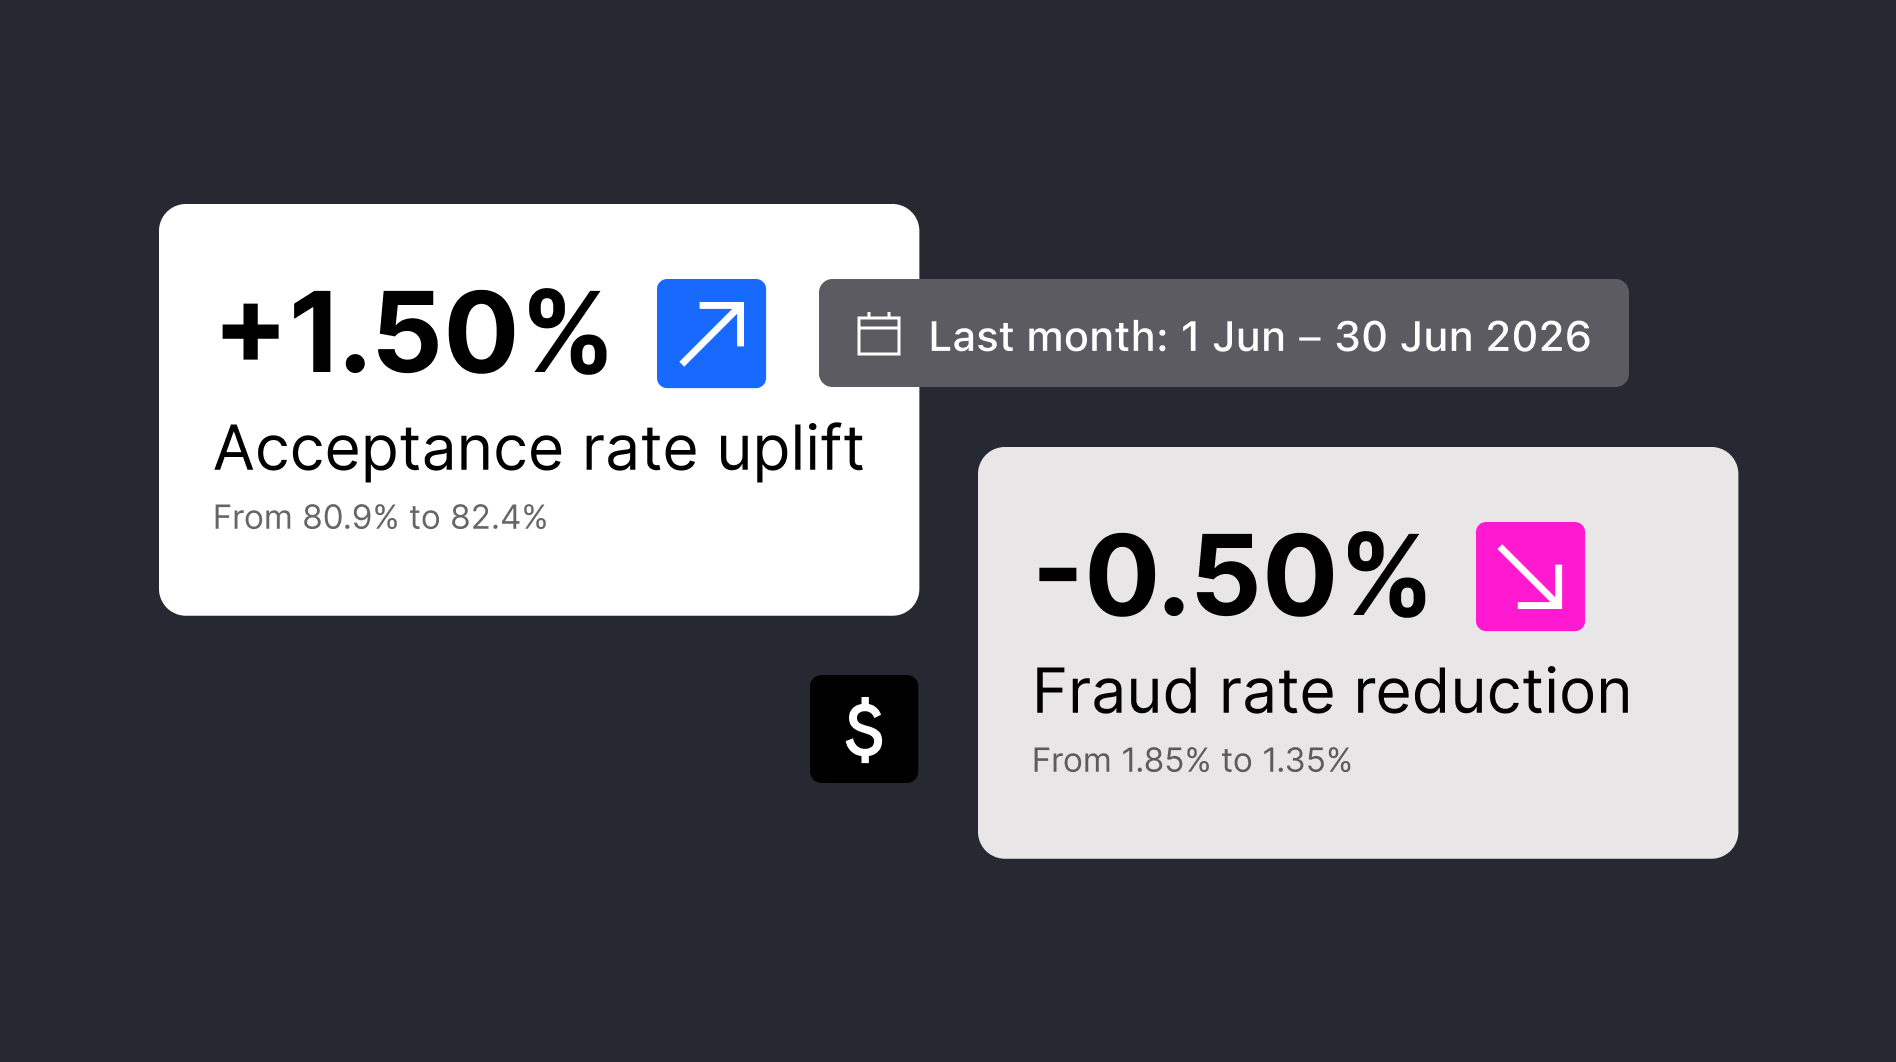
Areas of payments data to analyze for improved profit margin
Profit margin is an especially helpful lens through which to view payment strategy tweaks. Reason being your revenue gains (and cost savings) and highly like to be just that: marginal.
Yet it’s these minor adjustments that lead to gains of 0.5% here, 0.35% there that could add up to hundreds of thousands in boosted revenue (depending on the scale of your business).
Thanks to increasing competition within the payment processing space from a variety of next-generation fintech providers, businesses can achieve greater control over transaction routing. Let’s consider the most profitable payment metrics to analyze.
1. Processing speed
In a competitive online market, customers are increasingly picky about payment experiences. Believe it or not, over three quarters (76%) of UK buyers are willing to abandon their cart because payments take too long.
If you’re seeing losing sales and want to combat cart abandonment, then you should consider adding another payment processor channel. Preferably a faster one.
Before you make any big decisions, run some tests to establish a baseline for your payment processing speed. Use sandbox tools with dummy card data to simulate transactions, and record the time it takes for a representative sample to go through.
The speed of your payment processing will partly depend on the type of integration you have with your payment gateway. It is also related to the quality of the transaction data formatting, because optimizing your payment messaging will reduce the need for retries (automated or otherwise).
2. Authorization rates
When you focus on the percentages of payment attempts that succeed and fail authorization, look out for patterns and investigate weak links. For instance, a specific payment processor may consistently deliver lower authorization rates in a particular region compared with another PSP. It’s worth a call with your account manager to figure out why this is, and what could be done to improve it.
When looking at your authorization failure data, consider the proportion of payments failing due to expired card details. If it’s uncomfortably high, you should weigh up whether it’s worth implementing technology to securely store payment details with tokenization. This can reduce failed authorizations because card details will be automatically updated via network tokens.
Machine learning can automatically apply a range of adjustments to improve payments going through your business. Adaptive messaging takes into account past successful transactions to calculate the payment message formatting most likely to be authorized.
Furthermore, the Intelligent Acceptance engine can make thousands of individual tweaks to boost auth rate success. Using the Checkout.com analytics dashboard, you can even see the difference in the revenue you would have made without the improvements made by machine learning. You can view the percentage gains made thanks to different types of optimization.

3. Chargebacks
Chargebacks are a common profit eater; not only does your customer want their money back, but your staff have to invest time to investigate each case. You cannot know how much this is costing your business until you surface the metrics surrounding your chargebacks.
Certain data platforms allow you to build your own reports to visually represent your chargeback data. For example, the Checkout.com Data Explorer dashboard creates custom graphs according to your chosen parameters. The below bar chart displays the chargeback rates of three card countries in a given period.

This dashboard is interactive, so you can mouseover to view the chargeback rate and transaction count for the period.
The benefit of comparing chargeback rates is that it helps you prioritize effort. If you notice a problem with chargeback rates in your business, you can break down the data by card type, issuing bank, BIN number, currency, payment method, to name just a few parameters. This can help you pinpoint the particular issue, and guide problem solving.
Based off your chargeback metrics analysis, you can consider a few different strategies to reduce chargebacks:
- Clarify the wording of your sales terms and conditions on your website, as well as the returns and refunds policy for products or services.
- Offer proactive customer support to head off issues before they progress to chargebacks. This could be as simple as automated post-sales emails, including a returns label in the package or a installing a customer service chatbot on your website.
- Implement additional training for your sales representatives, so buyers are clear on exactly what they’ll be paying for.
- Consider adding 2FA to reduce claims of customer ignorance about card use.
- Add a fraud monitoring system to block untoward payment attempts.
- Collect a lot of data per transaction to improve your chance of winning disputes.
Of course, there is always the risk of chargeback fraud. We’ll look more closely at fraud in the next section.
4. Payment fraud analytics
Alarmingly, a growing number of US enterprises are experiencing payment fraud: 46% in 2023, up from 32% the year prior. Failing to keep up with fraud monitoring will not only ravage your balance sheets, it can damage your business reputation, incur costly legal action, and even restrict your ability to trade.
You’re better off analyzing your transaction metrics to detect fraud patterns. Maximizing revenue flow through high acceptance rates must be shrewdly balanced against fraud prevention. You’d do well to configure your checkout to use 3D Secure authentication protocols when certain user behaviors trigger suspicion of fraud.
One red flag for fraudulent activity is unusually high transaction velocity for no discernable reason. It’s worth drilling down into individual payment logs to look for signs of fraudulent payment attempts. For instance, you should check whether billing addresses are consistent with each repeat payment attempt.
Additionally, you should check if failed payments are retried in rapid succession. In this case, it’s prudent to modify your payment UI (namely, the structure and flow of the checkout process on your app or website from the customer’s point of view). You should block repeated transaction attempts with automated settings, and see if you can implement fraud checks prior to checkout, too.
A straightforward way to reduce potential payment fraud is to require customers to verify the email address connected to their account. You should also ensure purchase confirmation emails contain information about how to report fraudulent activity.
Surface data analytics insights with Checkout.com
Our sophisticated payments data analytics platform provides much-needed visibility over your incoming and outgoing payments. When you partner with Checkout.com, you gain access to best-in-class payment analysis tools that help you drive profitability.


.png)

.avif)